Staking Dashboard: Overview Print
Modified on: Wed, 11 Feb, 2026 at 1:51 PM
This article remains available for reference but is no longer updated or maintained.
Please use the information at your own discretion and risk.
For more details, refer to the official annoucenment.
The Staking Dashboard provides a very nice UI through which you can bond or unbond your tokens, select which validators to nominate, see their statistics, as well as statistics of the network, view your staking rewards, and more.
In this article, we go over the dashboard and briefly explain the various features. You can follow links to other articles that explain specific functionality in more detail.
Below is the screen you will encounter when first visiting the Staking Dashboard. We have numbered the sections for easy reference.
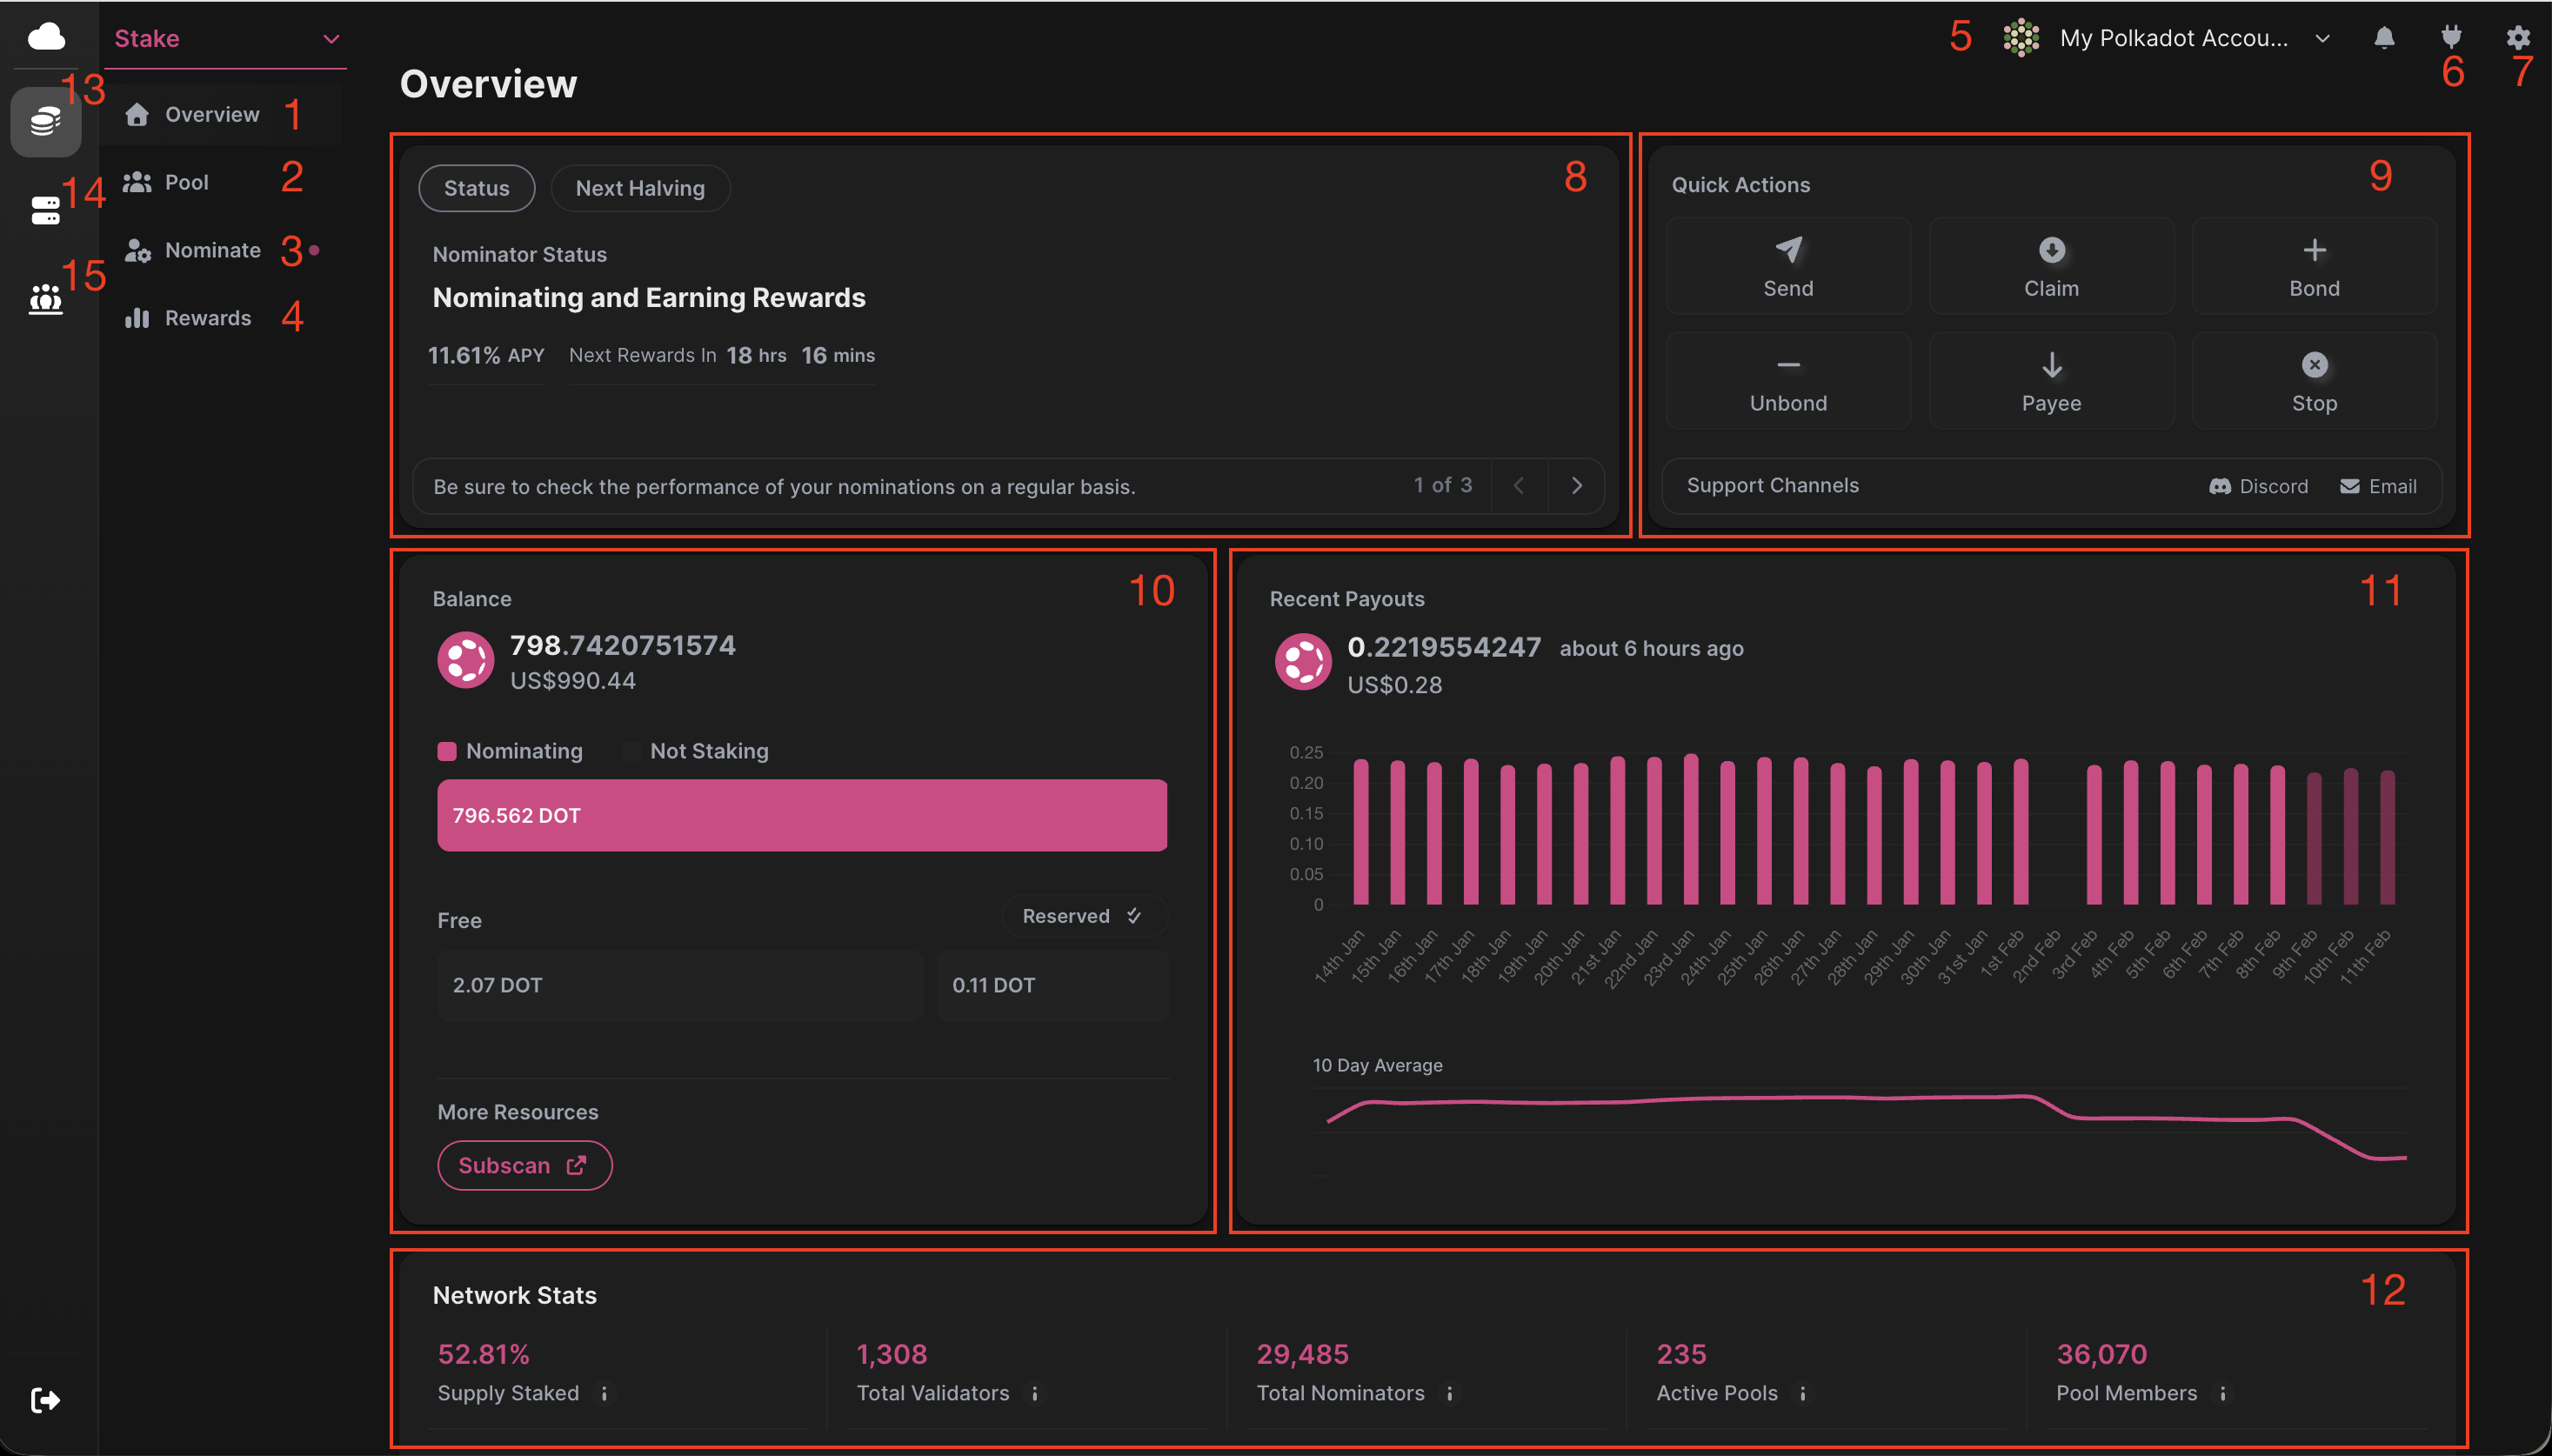
1. Overview tab: This is the Overview tab, where you can see information about the network and your account at a glance.
2. Pools tab: On this tab, you can join or create nomination pools. Check out this article for more nomination pool features.
3. Nominate tab: This is the tab where you can do most of the staking actions with your account and see the selection of your validators along with their status (active/inactive/waiting). More specifically, you can:
- Stake your tokens
- Bond more tokens
- Unbond your tokens
- Rebond your tokens while they are unbonding
- Change the Controller account
- Change the reward destination
- Change your nominations
4. Rewards tab: Here, you can see details about your recent staking rewards. Check out this guide for more info.
5. Account selection: Here, you can connect, disconnect, or switch your accounts.
6. Plug icon: Under the plug icon, you'll be able to connect your extension, Ledger, or Polkadot Vault.
7. Setting icon: In this area, you can change the network, language, currency, and other settings.
8. Staking status: In this area, you'll find your staking status and other important information, such as the next reward distribution, next halving, and more.
9. Quick Actions: This area shows shortcuts to the most common actions, allowing you to execute them with just one click.
10. Balances: This section displays your current account balance.
11. Recent Payouts: This shows the rewards received, their value, and the release date.
12. Network Stats: This displays network metrics such as the total staked supply, number of validators, etc.
13. Stake tab: This advanced section shows all the information related to staking.
14. Validators tab: In this tab, you'll find all the validators information and their metrics.
15. Pools tab: This advanced section shows all the pools information and their metrics.
And that's it! If you want to dive deeper into the Staking Dashboard, check out our related articles.
